|登录 |注册

查看: 1777|回复: 10
打印 上一主题 下一主题

[讨论] 股票讨论

[复制链接]
提示: 作者被禁止或删除 内容自动屏蔽
melodyc
2016-10-24 07:36 AM
我也想知道哦。。。。
杨国仁医师
2016-10-24 09:24 AM
暂时不要投资。。。
dawnchua0216
2016-10-24 10:50 AM
BORNOIL可以继续观察,钱很多

VIVOCOM是宝石
Air-Tr@ck
2016-10-24 08:22 PM
去investalks讨论吧
提示: 作者被禁止或删除 内容自动屏蔽
提示: 作者被禁止或删除 内容自动屏蔽
杨国仁医师
2016-10-25 10:39 AM
Christine620 发表于 2016-10-25 12:44 AM
怎么说? 市场不好吗?

市场是不错~~你不觉得有位老头几天就叫一次,吓到外资不敢进来,姨妈又傻傻的分不清楚。。。
提示: 作者被禁止或删除 内容自动屏蔽
teckhuat
2016-10-26 04:05 PM
Christine620 发表于 2016-10-25 12:50 AM
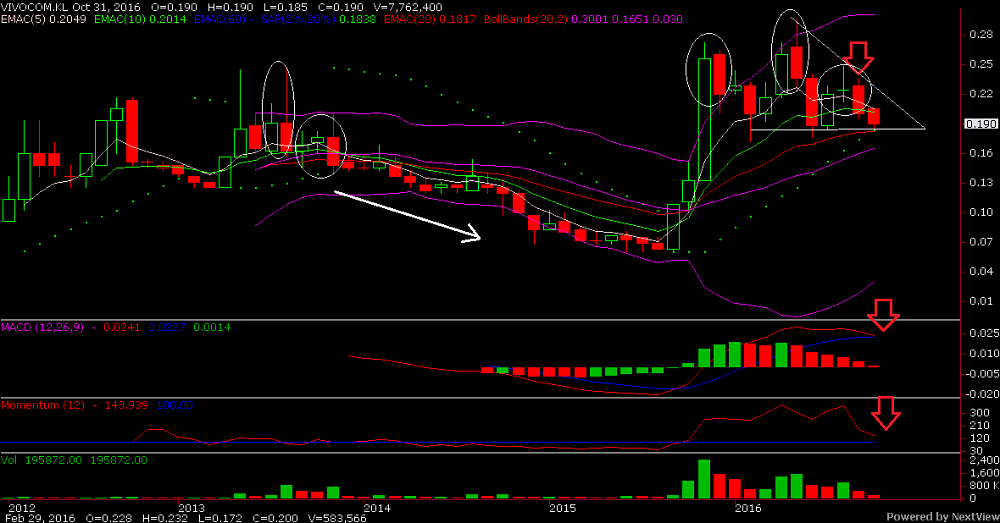
Vivocom 最近也是个热门股。 我也等机会进货,不过好像没什么新闻。。
有什么消息可以分享吗?
谢谢

Stock Alerts : Vivocom
Author: tradermans   |   Publish date: Tue, 25 Oct 2016, 05:37 PM


Vivocom monthly chart show:
1.Head and shoulder pattern
2.Evening star
3. Descending  triangle chart pattern
4.Macd dead cross soon
bearish signal....


What is a 'Head And Shoulders Pattern'
In technical analysis, a head and shoulders pattern describes a specific chart formation that predicts a bullish-to-bearish trend reversal. The head and shoulders pattern is believed to be one of the most reliable trend reversal patterns. It is one of several top patterns that signal, with varying degrees of accuracy, that an upward trend is nearing its end.
BREAKING DOWN 'Head And Shoulders Pattern'
This pattern is comprised of three component parts:

1. After a long bullish trends, the price rises to a peak and subsequently declines to form a trough.

2. The price rises again to form a second high substantially above the initial peak and declines again.

3. The price rises a third time, but only to the level of the first peak, before declining once more.

The first and third peaks are shoulders, and the second peak forms the head. The line connecting the first and second troughs is called the neckline.


What is an 'Evening Star'
An evening star is a bearish candlestick pattern consisting of three candles that have demonstrated the following characteristics: the first bar is a large white candlestick located within an uptrend; the middle bar is a small-bodied candle, red or white, that closes above the first white bar; and, the last bar is a large red candle that opens below the middle candle and closes near the center of the first bar's body. This pattern is used by traders as an early indication the uptrend is about to reverse.

The Evening Star
A candlestick requires a certain amount of information about a stock. You need to know the open, high, low and close price for the stock over the time period you want to analyze. Each candlestick consists of a candle and two wicks. The length of the candle is a function of price high and lows within the given time period. A long candle indicates a large change in price, while a short candle indicates a small change in price. In other words, long candlestick bodies are indicative of intense buying or selling pressure, depending on the direction of the trend. At the same time, short candlesticks are indicative of little price movement.

The evening star is a candlestick pattern containing two long candles and one short candle. The first candle in the pattern is a long bullish candle, indicating a long move up. The second candlestick in the pattern is a short candlestick indicating price consolidation and indecision. In other words, the trend that created the first long, bullish candlestick is losing momentum. The final candlestick is a long bearish candlestick gaping lower than the previous candlestick, indicating a confirmation of the reversal and the beginning of a new trend down.


BREAKING DOWN 'Descending Triangle'
A bearish chart pattern used in technical analysis that is created by drawing one trendline that connects a series of lower highs and a second trendline that has historically proven to be a strong level of support. watch for a move below support, as it suggests that downward momentum is building. Once the breakdown  short positions and aggressively push the price of the asset lower.

Macd dead cross
The golden cross and the death cross are exact opposites. The golden cross indicates a long-term bull market going forward, and the death cross signals a long-term bear market. Both refer to the solid confirmation of a long term trend by the occurrence of a short-term moving average crossing over a major long-term moving average.


您需要登录后才可以回帖 登录 | 注册

JBTALKS.CC |联系我们 |隐私政策 |Share

GMT+8, 2025-2-10 05:16 PM , Processed in 0.083075 second(s), 21 queries .

Powered by Discuz! X2.5 © 2001-2012 Comsenz Inc.

本论坛言论纯属发表者个人意见,与本论坛立场无关
Copyright © 2003-2012 JBTALKS.CC All Rights Reserved

Dedicated Server powered by iCore Technology Sdn. Bhd.

合作联盟网站:
JBTALKS 马来西亚中文论坛 | JBTALKS我的空间 | ICORE TECHNOLOGY SDN. BHD.
回顶部